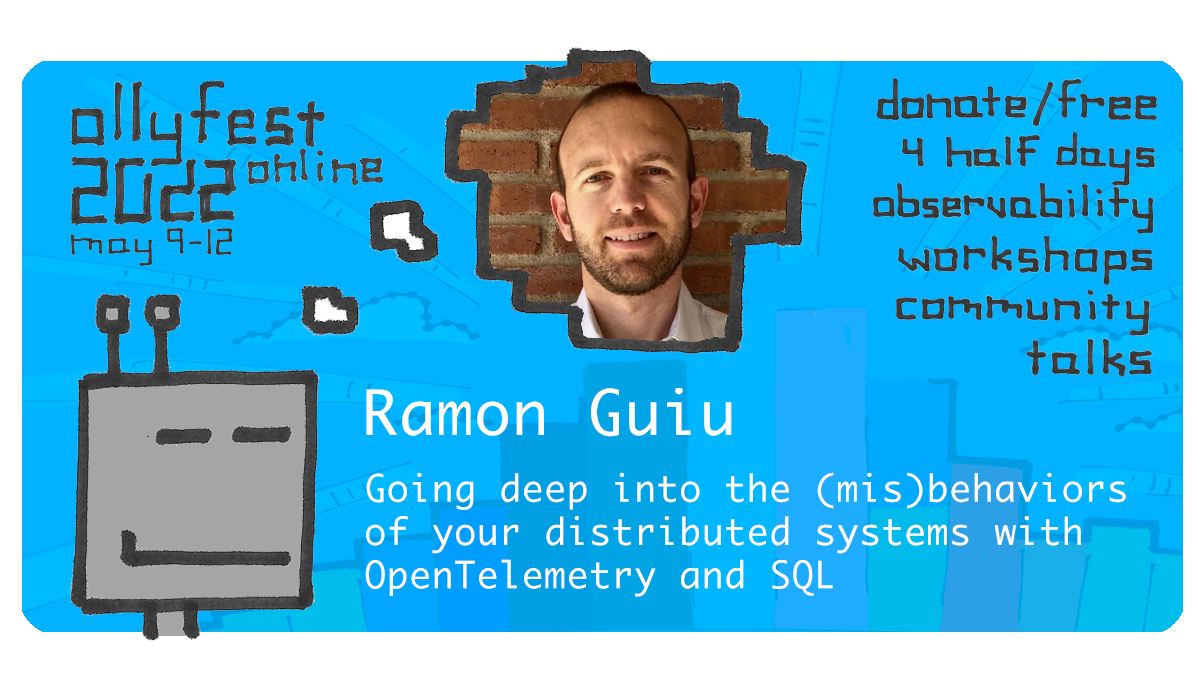
Going deep into the (mis)behaviors of your distributed systems with OpenTelemetry and SQL
Traces hold a treasure of information about how all the different components in your systems behave and interact. Yet, open source tools for analyzing trace data typically focus on investigating individual traces and SaaS tools allow you to query traces for basic data aggregation or pre-defined analysis and correlations. But the hardest problems require the ability to slice and dice, aggregate, join and analyze the data in very specific ways that are usually not available in these tools.
In this talk, we will show how you can query OpenTelemetry traces with good old SQL to identify unexpected behaviours in your microservices and narrow down on where bottlenecks are occurring to answer questions like:
“For service X with elevated load, show me which upstream service is causing the load,” or “Show me the cost of requests A, B, and C in terms of backend work in this service”
To perform this analysis, we will use free tools. We will send OpenTelemetry traces to a TimescaleDB/PostgreSQL database via Promscale and we will use Grafana to visualize the results of SQL queries against that database.
More about Ramon Guiu
Ramon is VP of Observability products at Timescale where he is building Promscale, a unified observability backend for metrics, traces and logs on top of TimescaleDB and PostgreSQL.
Before Timescale, Ramon was VP of Product Management at New Relic where he initially led their infrastructure monitoring product and later their transition to open instrumentation standards including Prometheus, OpenMetrics and OpenTelemetry.
